


GBP/USD – Weekly Technical Analysis (08.09.2014-12.09.2014)


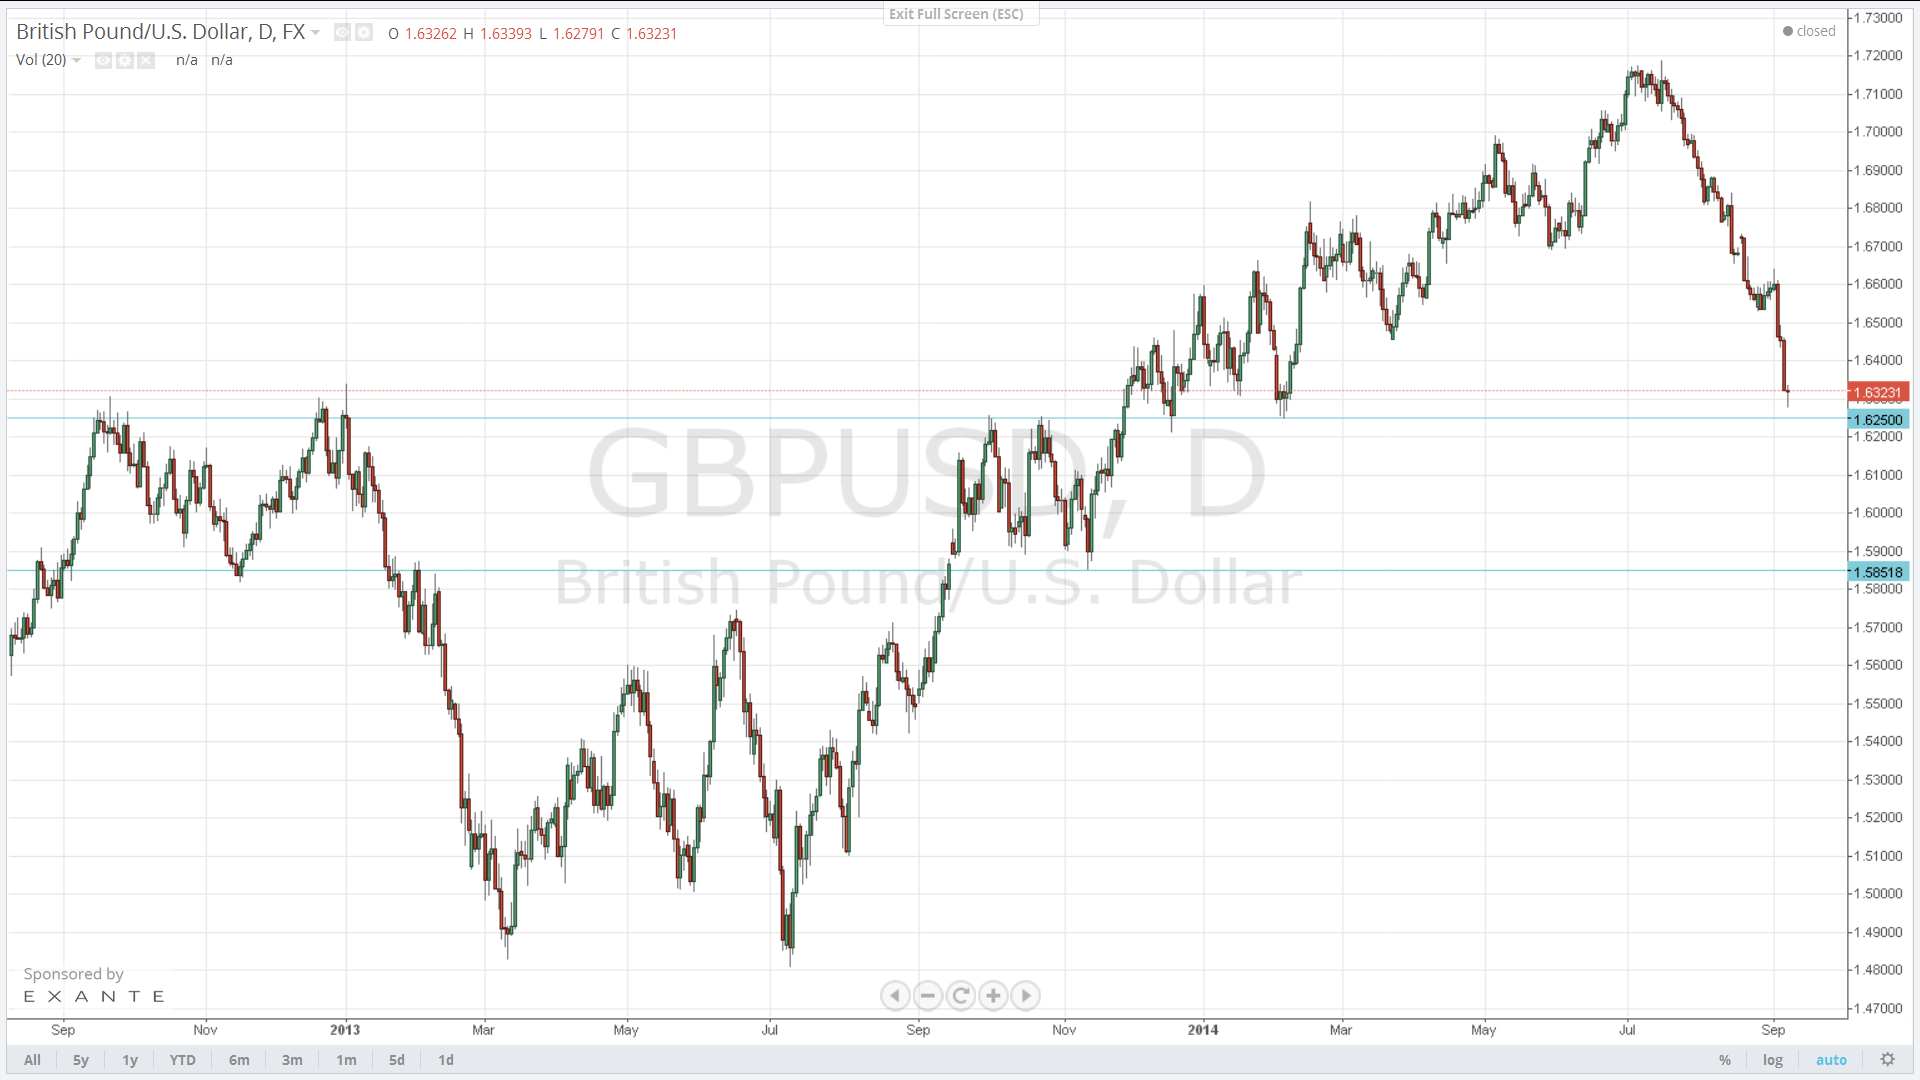
Last week, GBP/USD faced some serious selling pressure and touched a seven-month low of 1.6262 on Friday. The pair bounced from the technical support located there for a daily close of 1.6326.
At this stage we expect a correction, and the arguments for that are several: first, the GBP/USD reversed after hitting the 1.6262 support, which demonstrates buying interest at this level; second, the sterling’s initial slide on Friday, followed by a bounce, resulted in a “doji” candlestick formation (see chart), which is a strong reversal signal; third, the RSI (14) is currently at 18.25, showing that the GBP/USD is clearly in an oversold territory.
We favor just a technical correction rather than a reversal of the pound’s slide. A movement to the upside would first target the 1.6457 resistance. We will be looking for signs that the correction is losing steam somewhere around 1.6457 to turn bearish again. Please, note that a break through the 1.6262 support would turn the bias back to negative.
See technical update:
http://www.profitease.com/trading-hints/gbpusd-technical-update/1180/


